
How to get started with Copilot in Excel
- Maxime Hiez
- Copilot
- 20 Feb, 2025
Introduction
Microsoft 365 Copilot is a major innovation that integrates artificial intelligence directly into the applications you use every day, like Excel. Copilot helps you automate tasks, analyze data and make decisions faster. Here’s how you can start using Copilot in Excel and get the most out of its features.
What is Copilot in Excel?
Copilot in Excel is an AI assistant that helps you work more efficiently with your data. It can generate analytics, create visualizations, automate repetitive tasks, and provide insights based on your data. Copilot uses advanced language models to understand your queries and provide relevant responses.
How to get started with Copilot in Excel ?
Access Copilot
- Open Excel and make sure you are signed in to your Microsoft 365 account.
- Find the Copilot icon in the ribbon or use the dedicated keyboard shortcut to open the Copilot pane.
Use Copilot prompts
- Copilot works with prompts, which are instructions or questions you ask it. For example, you can ask Copilot to “create a monthly sales chart” or “average expenses”.
- Type your prompt in the Copilot pane and press Enter. Copilot will analyze your request and provide an appropriate response or action.
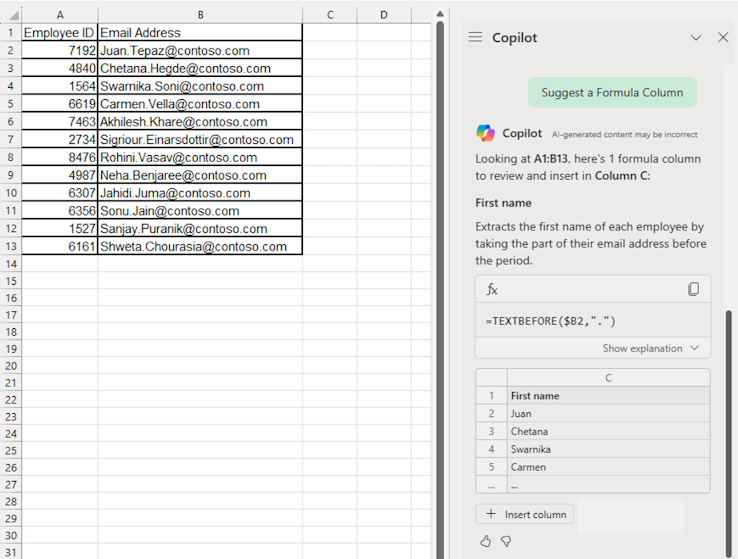
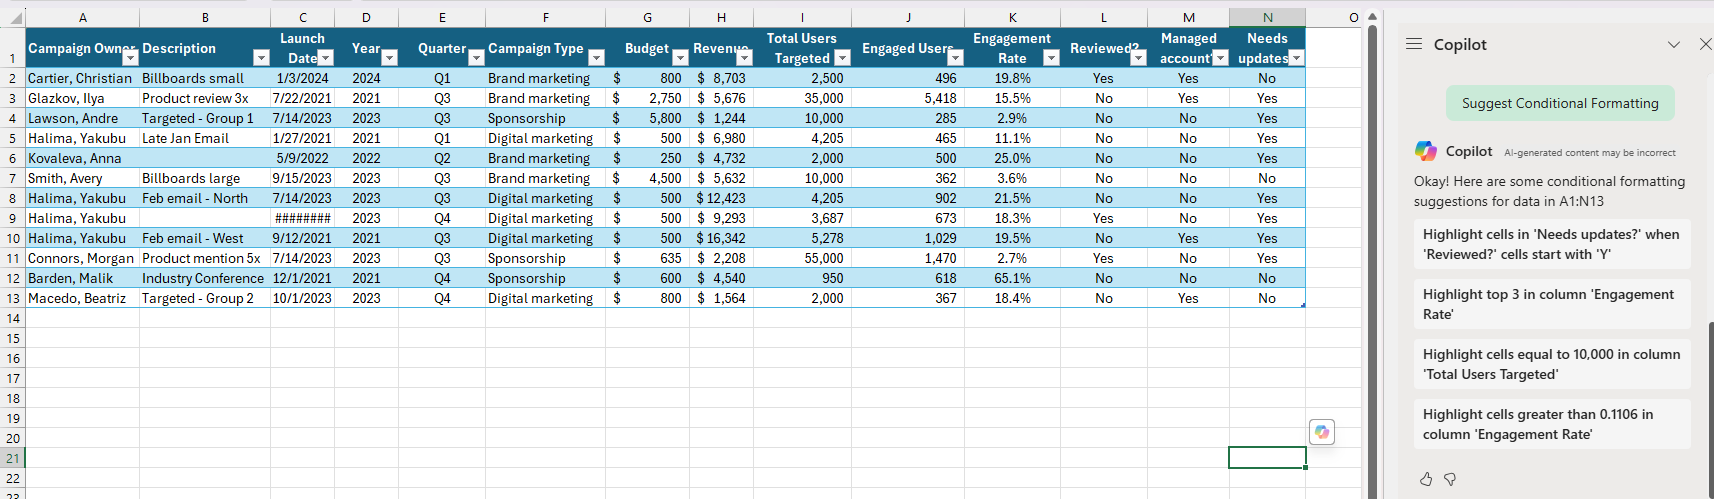
Explore Copilot suggestions
- Copilot can also offer you suggestions based on the context of your spreadsheet. For example, if you are working on a financial data table, Copilot can suggest relevant analyzes or useful visualizations.
- Click the suggestions to apply them directly to your spreadsheet.
Key features of Copilot in Excel
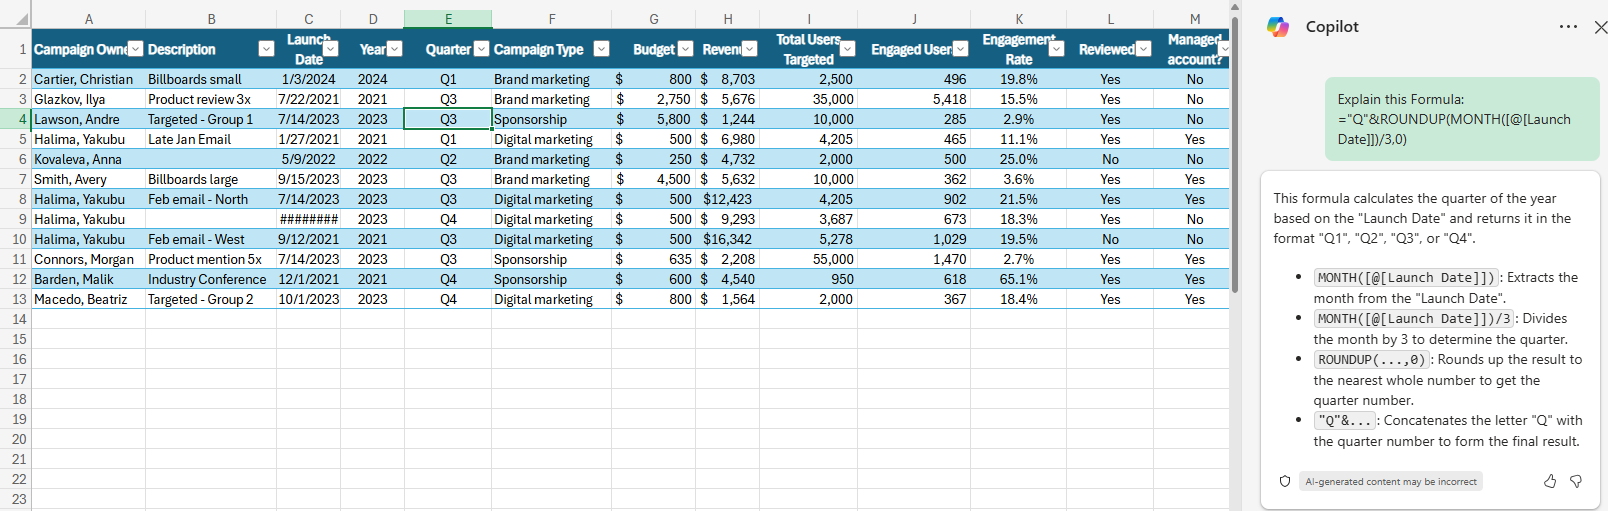
Data analysis
- Copilot can analyze your data and provide valuable insights. For example, it can identify trends, anomalies or correlations in your data.
- Use prompts like “sales analysis by region” or “identify growth trends” to get detailed analyses.
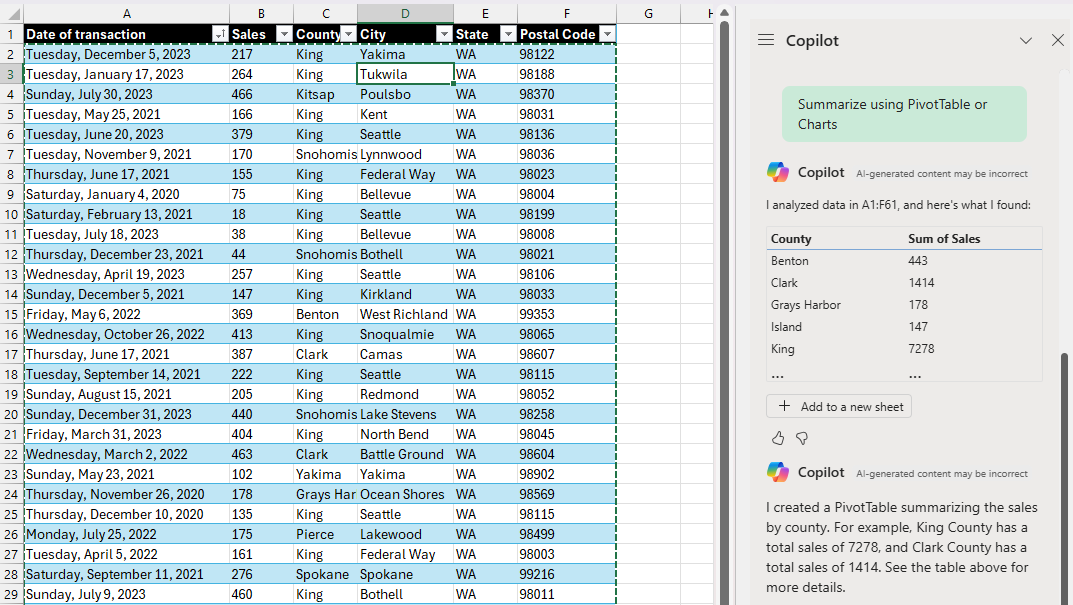
Task automation
- Copilot can automate repetitive tasks like data cleaning, creating pivot tables or generating reports.
- Ask Copilot to “clean data” or “create monthly report” to save time and reduce errors.
Creating visualizations
- Copilot can create charts and visualizations based on your data. It can choose the most suitable type of chart and customize it according to your needs.
- Use prompts like “create quarterly sales bar chart” or “generate expense histogram” to visualize your data clearly and concisely.
Benefits of using Copilot in Excel
- Save time : Copilot automates tedious tasks, allowing you to focus on higher value-added activities.
- Increased accuracy : Using advanced language models, Copilot reduces errors and improves the accuracy of analytics and reporting.
- Relevant insights : Copilot provides insights based on your data, helping you make informed decisions faster.
Conclusion
Copilot in Excel is a powerful tool that can transform the way you work with data. By automating tasks, providing analytics, and creating visualizations, Copilot helps you save time and improve the accuracy of your work. Feel free to explore Copilot’s features and integrate it into your daily workflow to maximize your productivity.
Sources
Did you enjoy this post ? If you have any questions, comments or suggestions, please feel free to send me a message from the contact form.
Don’t forget to follow us and share this post.